Home / Shop
13-04-23 - Gantt Chart for Multiple Jobs
$740.00
A one-time price of $740.00 will be added to your order.


- Description
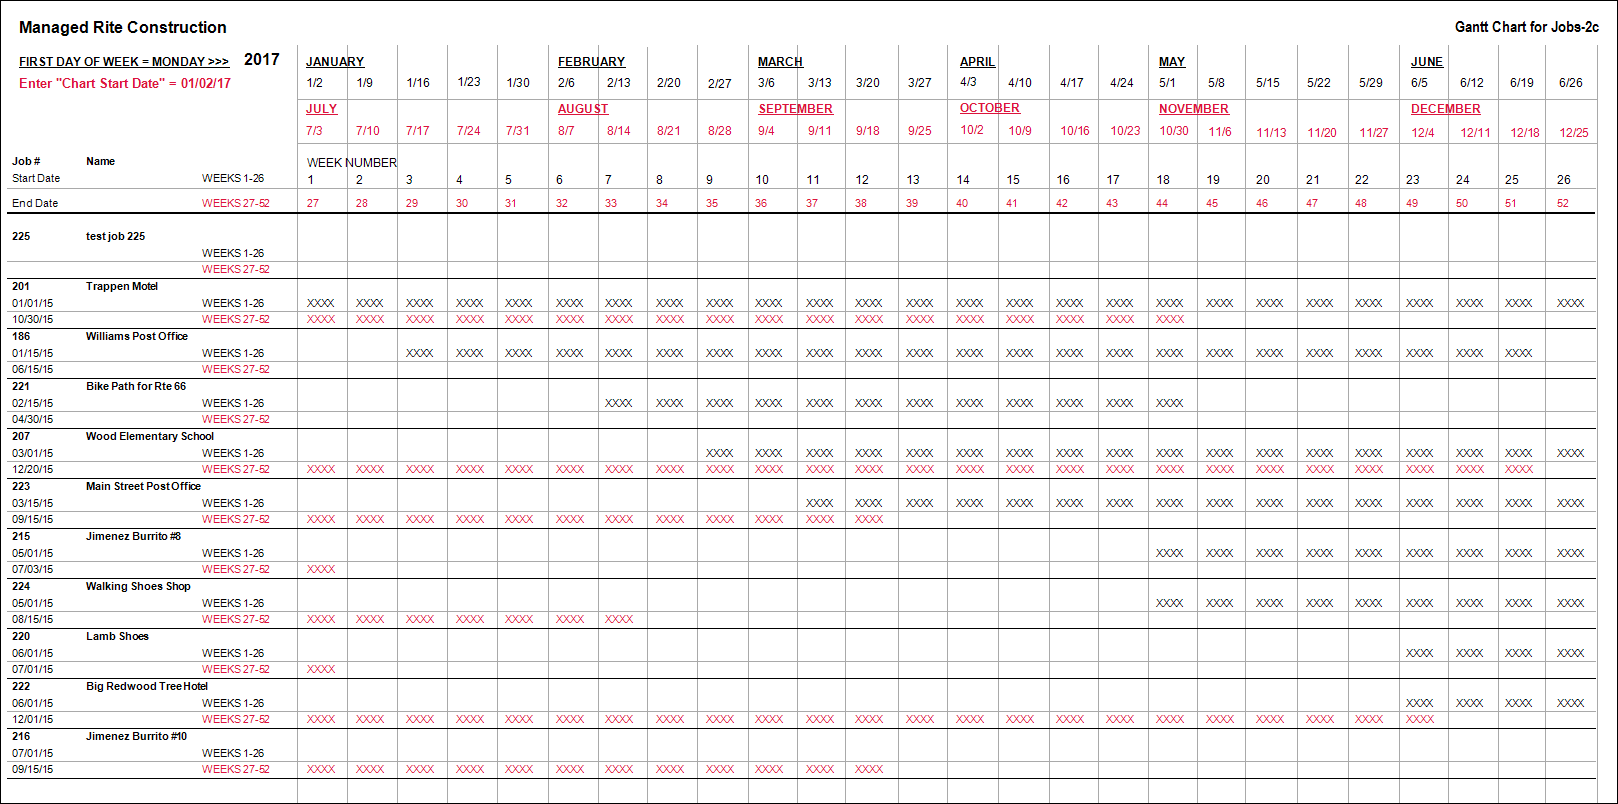
13-04-23 - Gantt Chart for Multiple Jobs
Report Description:
Groupings & Subtotals: Project Started Date, Job #
Notes: None
Pop-Up Screen: Chart Start Date
Compare overlap on multiple jobs on a 52 weekly Gantt Chart.
Enter Project Started and Project Finished dates in 3-5 job screen (once only).
When running report enter Chart Start Date (the date of the 1st Monday of the current year).
No other entry required.
Two lines per job show on report. Easily see overlap of muliple jobs.